Early in the pandemic I discovered a website called Statshunters. When you authorize the website to use your Strava history it visualizes your Strava activities with heatmaps, statistics, and badges.
The tiles tracked in Statshunters are Level 14 tiles, and divide the world into a grid of 16,384 by 16,384 squares, each one measuring about 2 km wide. To get to level 14, you start at level 0 which is one single tile representing all the world below about 85 degrees North and above 85 degrees South. You then zoom in to split that tile into 4 equal-sized tiles, each with a side half the length of the first tile. This gets you level 1. Then you zoom in again splitting those four tiles into four tiles each, making a total of 16 tiles covering the whole world at level 2, each with a length of a quarter of the length of the original. So at level 2 you have a total of 4*4 = 16 tiles. Split the tiles 12 more times and you get to level 14, so there are 16,384*16,384=268,435,456 level 14 tiles.
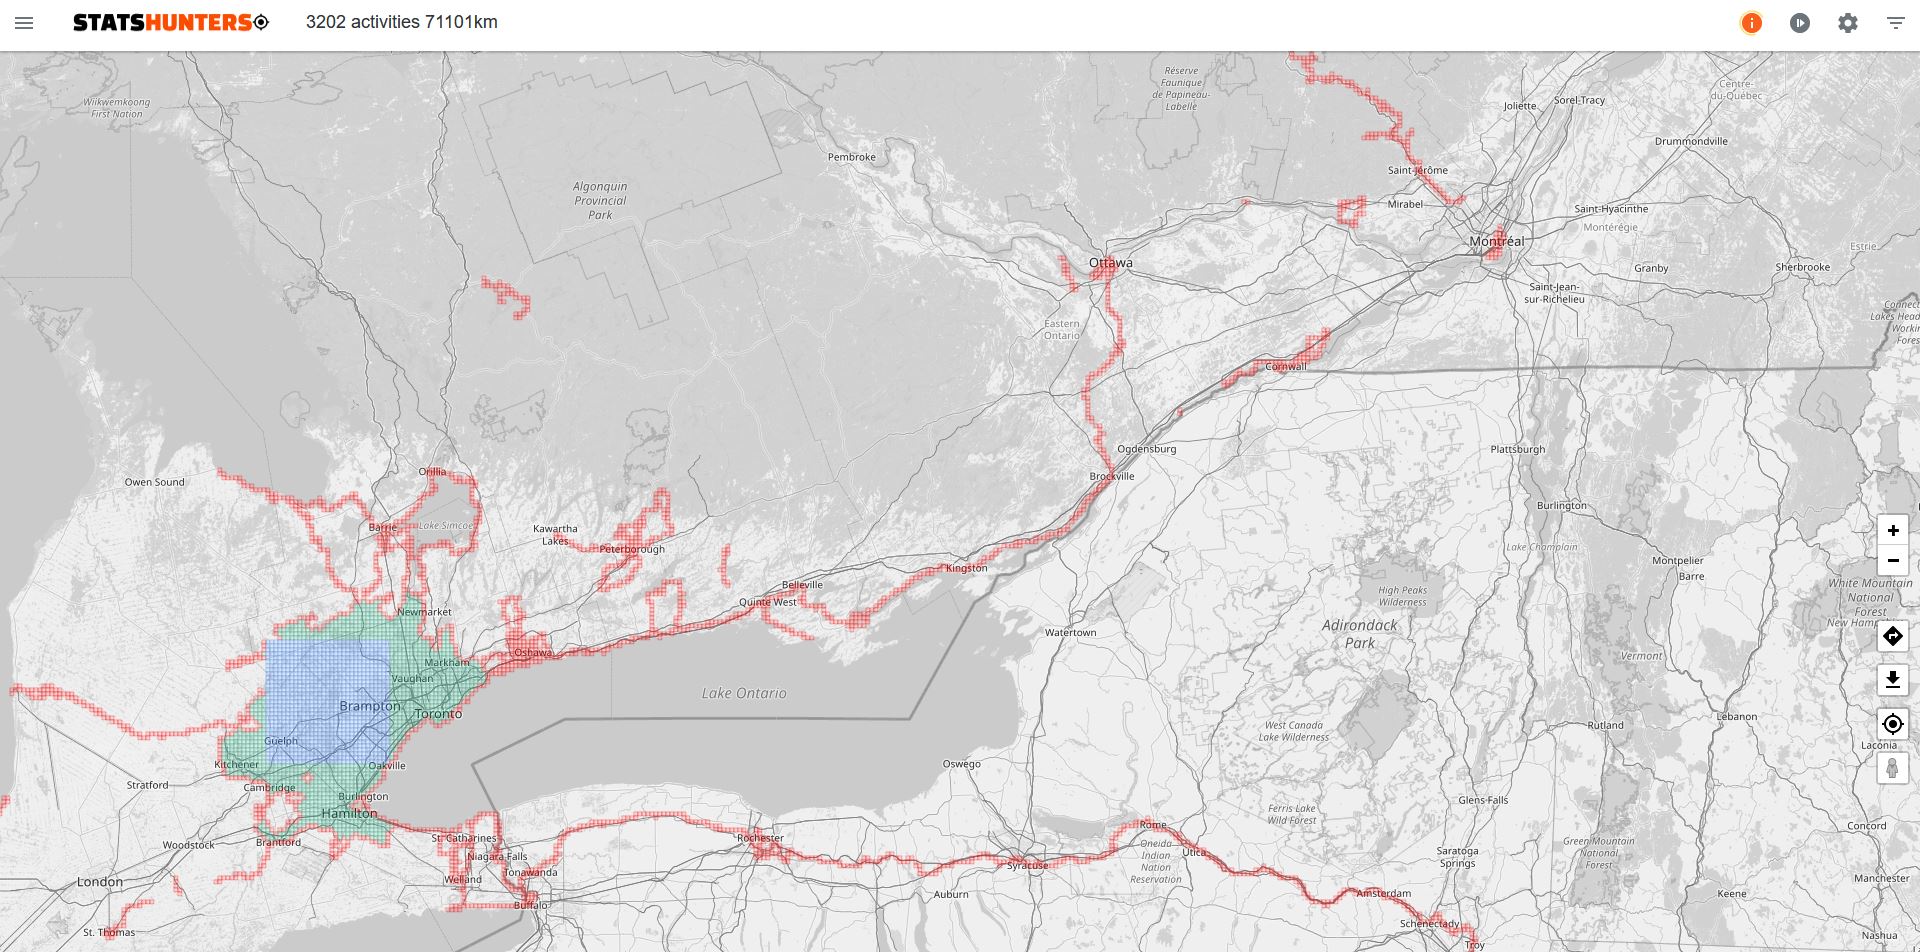
It’s a fun pursuit to try to visit as many tiles as you can using only human power. Statshunters shows the Total Tiles you have visited (in Red if not in your square or cluster), and also the Max Square of tiles you have (in Blue) and the largest cluster of tiles (Green). A tile is in the cluster if you have collected the four tiles that connect to it.
This is what my map looks like:
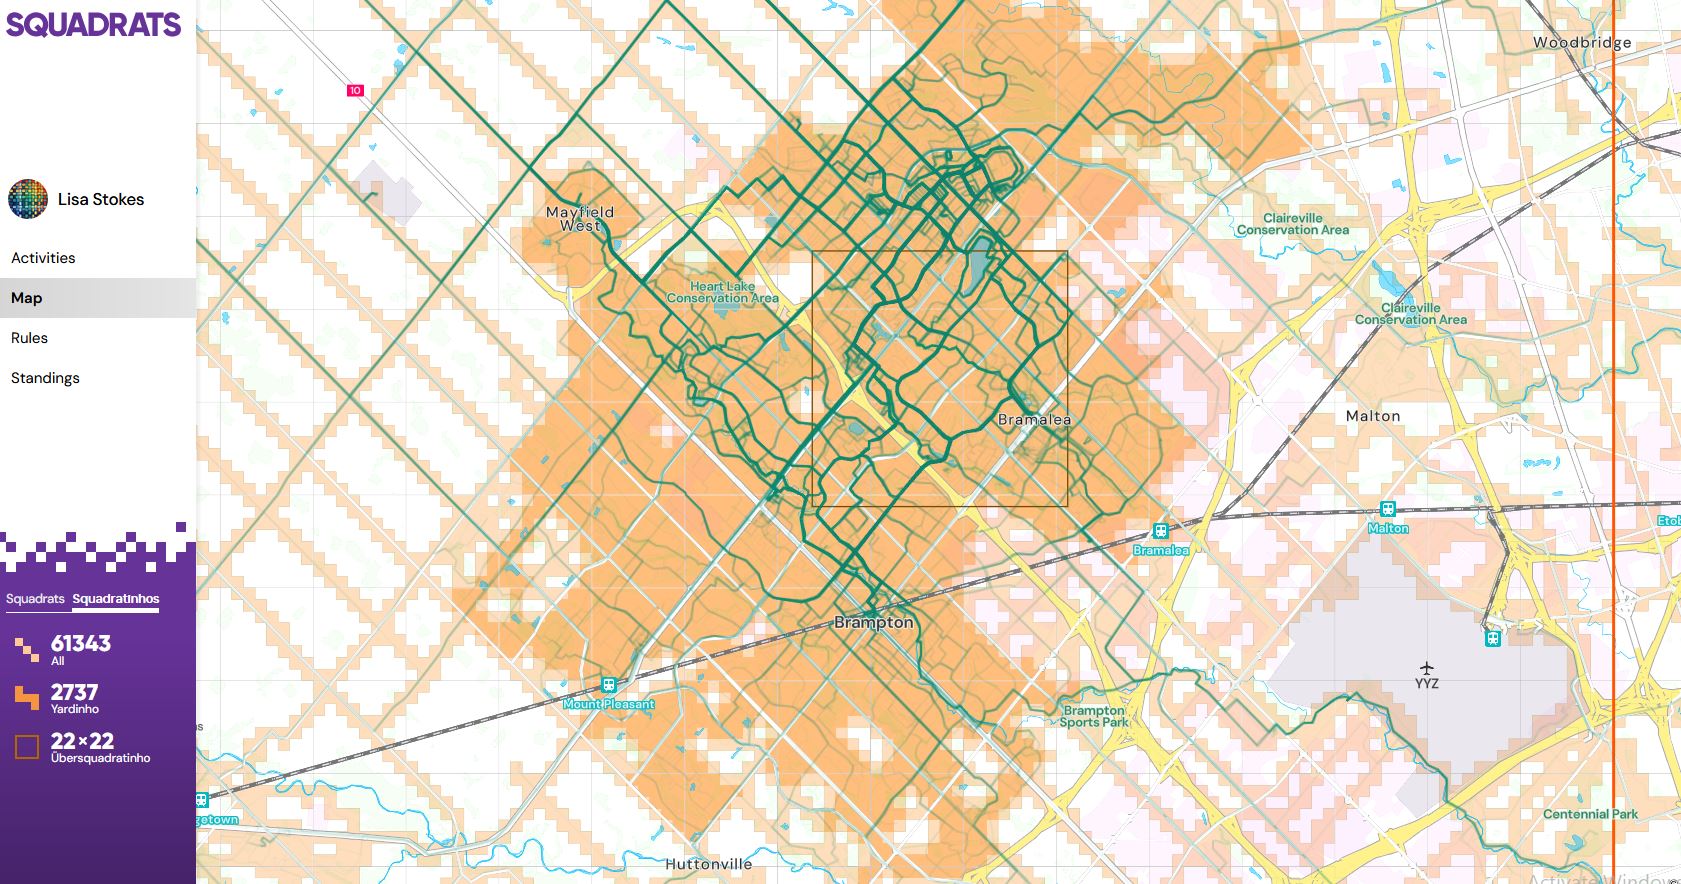
It becomes increasingly difficult, when riding from home, to collect new tiles, which has led to my new activity of collecting Squadratinhos, tracked by a website called Squadrats.com. These are Level 17 tiles, and there are 64 Level 17 tiles in one Level 14.
This is what my Squadrats map looks like:
Squadrats doesn’t have as much functionality as Statshunters, missing a statistics page, activity page that can be filtered, and ability to upload routes. But it is still a fun addition to my cycling.